El Niño 2026 and what it has historically meant for Argentina
El Niño is here and models put its peak between October and December, right when Argentina's maize and soybeans are being established. We looked at 45 years of data to see what that has historically meant, district by district.

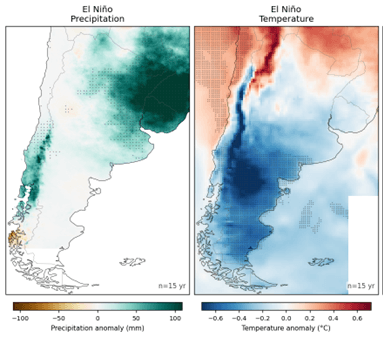
Between October and January, Argentina's agricultural year is decided. Maize and soybeans go into the ground, the last of the wheat comes off, and how much rain falls in those weeks sets the outcome for everything that follows.
El Niño has been building in the Pacific since December 2025, and every forecasting model now puts its peak in exactly those months, in the strongest category on the scale. On the historical record that means considerably more rain than normal across northeastern Argentina and Uruguay, arriving when the fields are least able to take it. Reason enough to look at the season now rather than in December.
The state of the Pacific
El Niño is here. NOAA raised its alert to El Niño Advisory on 11 June 2026, and the Pacific has kept warming since. The Niño 3.4 index, which tracks temperatures in the central Pacific, ran 1.55 °C above normal in June and 2.1 °C above in mid-July. Two degrees separates a strong event from a very strong one, a line last crossed in 1982-83, 1997-98 and 2015-16.
The atmosphere is responding too, which is what separates a real event from a passing warm spell. The trade winds have weakened, tropical rainfall has shifted east across the Pacific, and Indonesia and Papua New Guinea have turned unusually dry. There is also more warmth stored below the surface, still to come up. The event has room to grow.
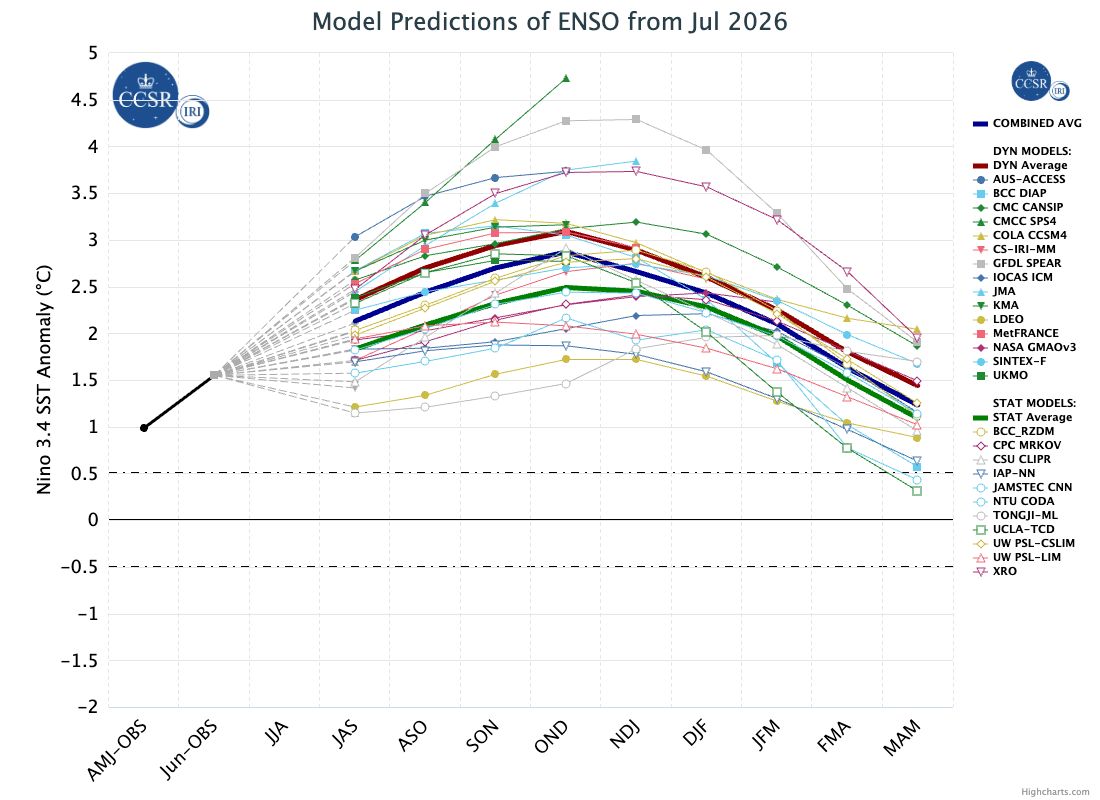
FIGURE 1: Forecasts of Pacific temperatures from 26 different climate models, issued in July 2026. Every line stays in El Niño territory through early 2027. Source: IRI / Columbia Climate School.
The models agree to an unusual degree. Twenty-six of them are run every month by centres around the world. All twenty-six keep El Niño in place through the end of the year and into 2027, twenty-three put the peak between October and December, and none of them shows any chance of a swing back to La Niña. NOAA puts the odds of the event lasting into early 2027 at 97%.
What is still open is how big it gets. The models range from 1.7 °C to 4.3 °C at the peak, so the direction is settled and the size is not. Forecasts made earlier in the year are usually far less reliable than this, and the reason these are so firm is that the hardest stretch of the year to predict is already behind us.
El Niño over Argentina
Knowing El Niño is coming only helps if you know what it has done before to the place you care about. So we looked at the record.
Using forty-five years of satellite rainfall and temperature data, we measured how much rain fell across southern South America in past El Niño years compared with an average year, point by point on a grid of about 5 km.
Two seasons matter most for the event now building.
October to December is the season the models point to as the peak. In past El Niño years, Corrientes, Misiones, eastern Entre Ríos, Uruguay and southern Brazil received more than 100 mm of extra rain over those three months, and the wetter-than-normal signal extends reliably across a much wider area reaching into Santa Fe and northern Buenos Aires. A second wet band appears along the Andes in central Chile and Cuyo. Temperatures across central and southern Argentina tend to run slightly cooler than usual, by up to half a degree, which is what more cloud and more rain will do. The northwest is the exception and tends to run warmer.
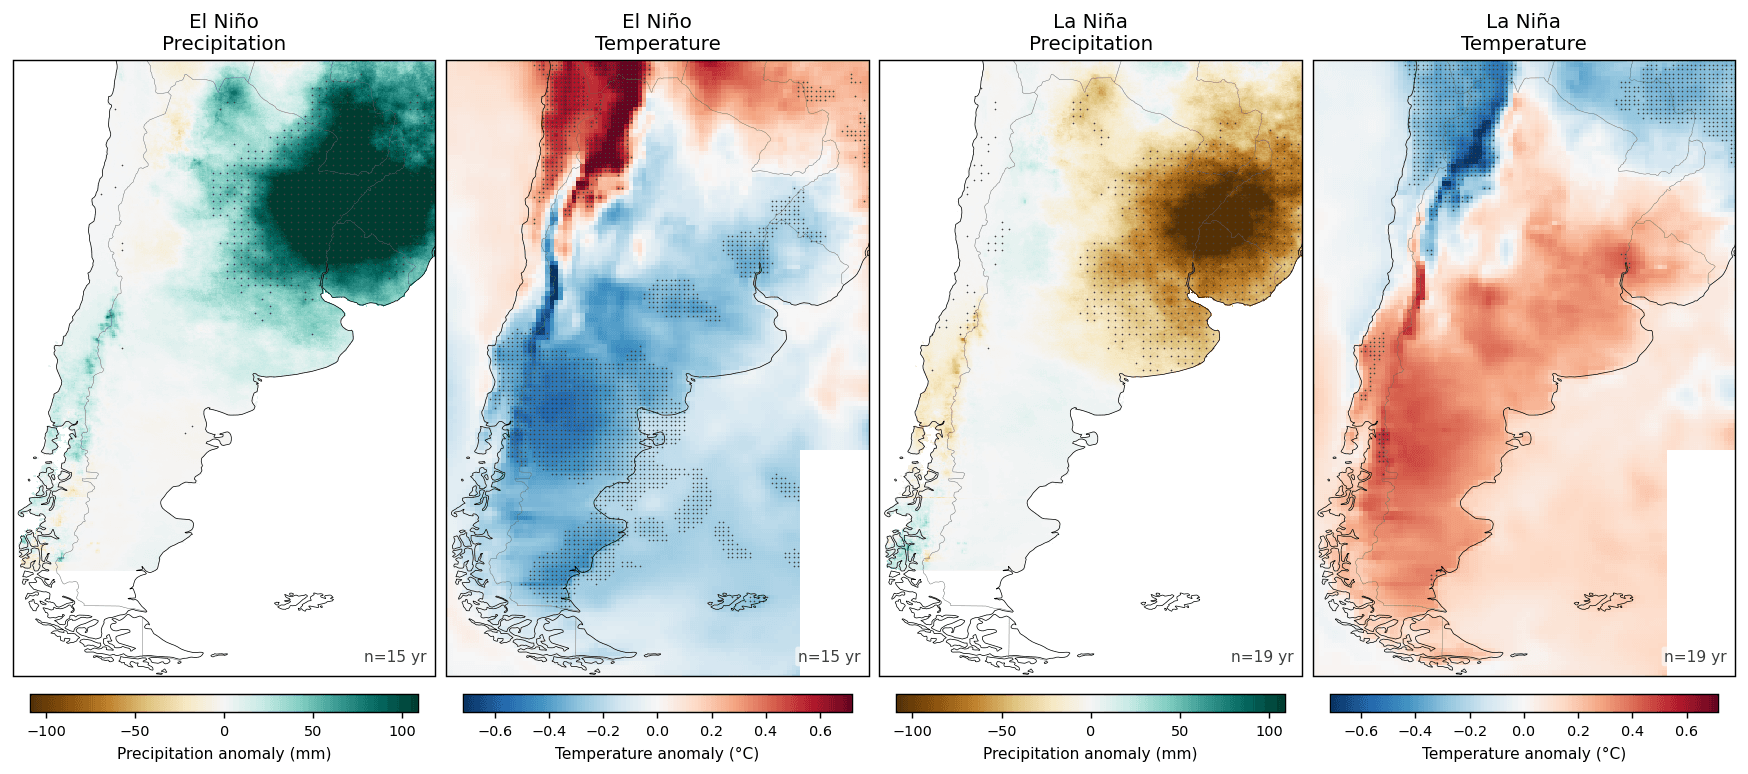
FIGURE 2: How October to December has differed from an average year, in El Niño years (15 of them since 1981). The dots mark where the pattern is consistent enough to be trusted. Rainfall from CHIRPS, temperature from ERA5.
November to January shows the same pattern, tighter and more consistent. The wettest area sits squarely over the Litoral and Uruguay. These are the months when maize and soybeans are being planted and established, and when the last of the wheat is coming off. Extra water at this point in the calendar is not a gift. Saturated fields delay planting, compact the soil and encourage disease, and across the flatter parts of the Pampas standing water can sit for weeks.
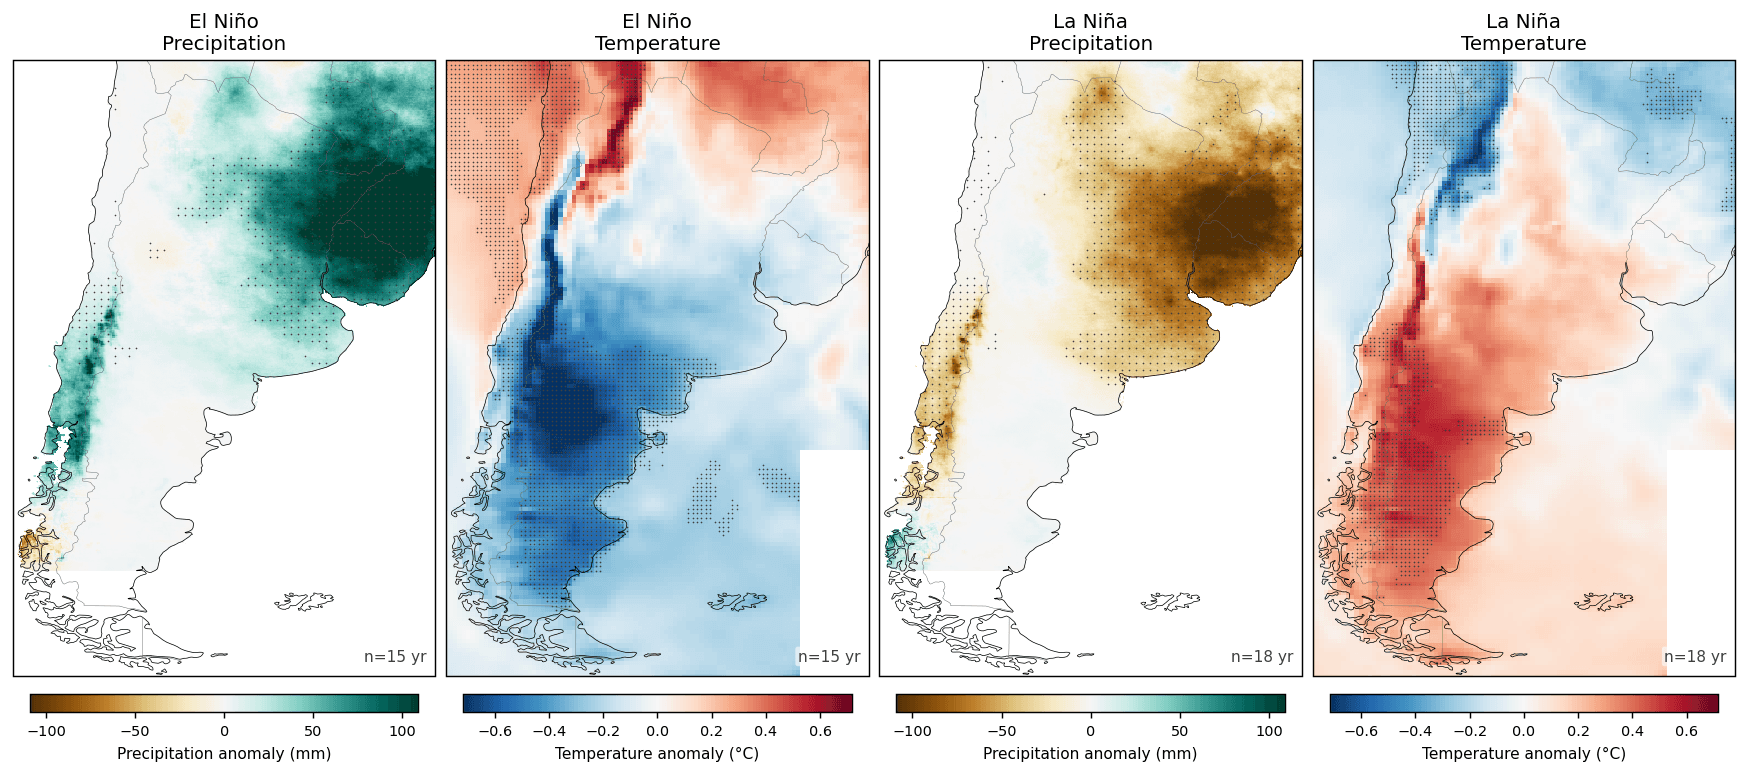
FIGURE 3: The same comparison for November to January, the months when maize and soybean crops are getting established across the Pampas.
These maps are averages, so they shift the odds without settling the outcome, and individual El Niño years have departed a long way from the average. A stronger event in the Pacific does not translate into proportionally more rain over Argentina. And the signal weakens in midsummer before reappearing over the Pampas in January to March, a reminder that the calendar's usual divisions can hide as much as they show.
Risk transfer
A seasonal forecast tells you which way the year is likely to lean. A map like this one tells you where, when and how much, district by district rather than country by country. Put the two together and a bank, a cooperative or an insurer can act before the season instead of after it.
That is the case for parametric cover built on satellite data. The same rainfall measurements used to draw these maps can define a trigger, track a season and settle a claim, with no loss adjuster and no farm visit. When the signal is this readable six months ahead, waiting is the expensive option.
We are already working on this with partners in Argentina, Bolivia, Peru and Brazil. If you have exposure to the 2026-27 season and want to see what it looks like on your own footprint, we would be glad to hear from you.