Reading the waves
How Suyana built an ocean model to protect Peru's Fishing communities
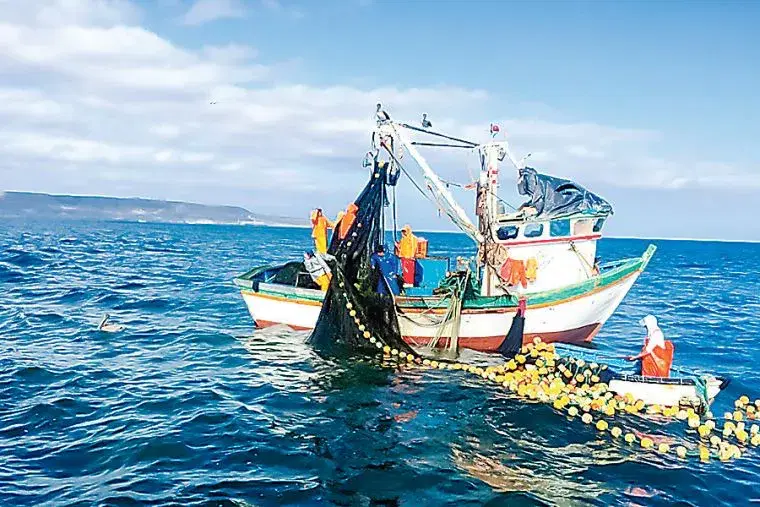
A fishing boat navigates the waters off Peru's northern coast
A ship in harbor is safe, but that is not what ships are built for.
- John A. Shedd
Peru's fishing communities face a constant battle against the sea. When powerful storms generate towering waves that crash against the coastline, fishing ports must close, leaving tens of thousands of fishermen unable to work and families without income. But what if we could predict these dangerous conditions days in advance? Suyana’s Climate Data team has developed sophisticated tools to do exactly that, combining cutting-edge ocean modeling with economic analysis to understand and forecast the impact of extreme wave events.
1 / Reading the waves
Analysis begins with data preparation which is the crucial but often invisible foundation of any analytical endeavor. This complex process transforms raw oceanographic data into a format suitable for analysis, starting with historical wave measurements from the SWAN (Simulating Waves Nearshore) model, tuned to closely resemble wave heights at specific validation points with available satellite data. These ocean simulations provide detailed hourly predictions of wave heights and ocean conditions along Peru's coast, spanning several years and covering multiple coastal regions, each with its unique challenges, such as highly irregular coastlines or coarse bathymetric data.
A critical part of this preparation involves establishing event definitions, essentially recognizing when wave conditions become dangerous enough to force port closures. Rather than using arbitrary thresholds, we analyze patterns in the data to identify events of different durations and intensities. A one-day spike in wave height might not be significant, but when dangerous conditions persist for five or more consecutive days, the economic impact becomes substantial. This nuanced approach allows the analysis to capture both brief weather disturbances and the extended storm systems that cause the most damage.
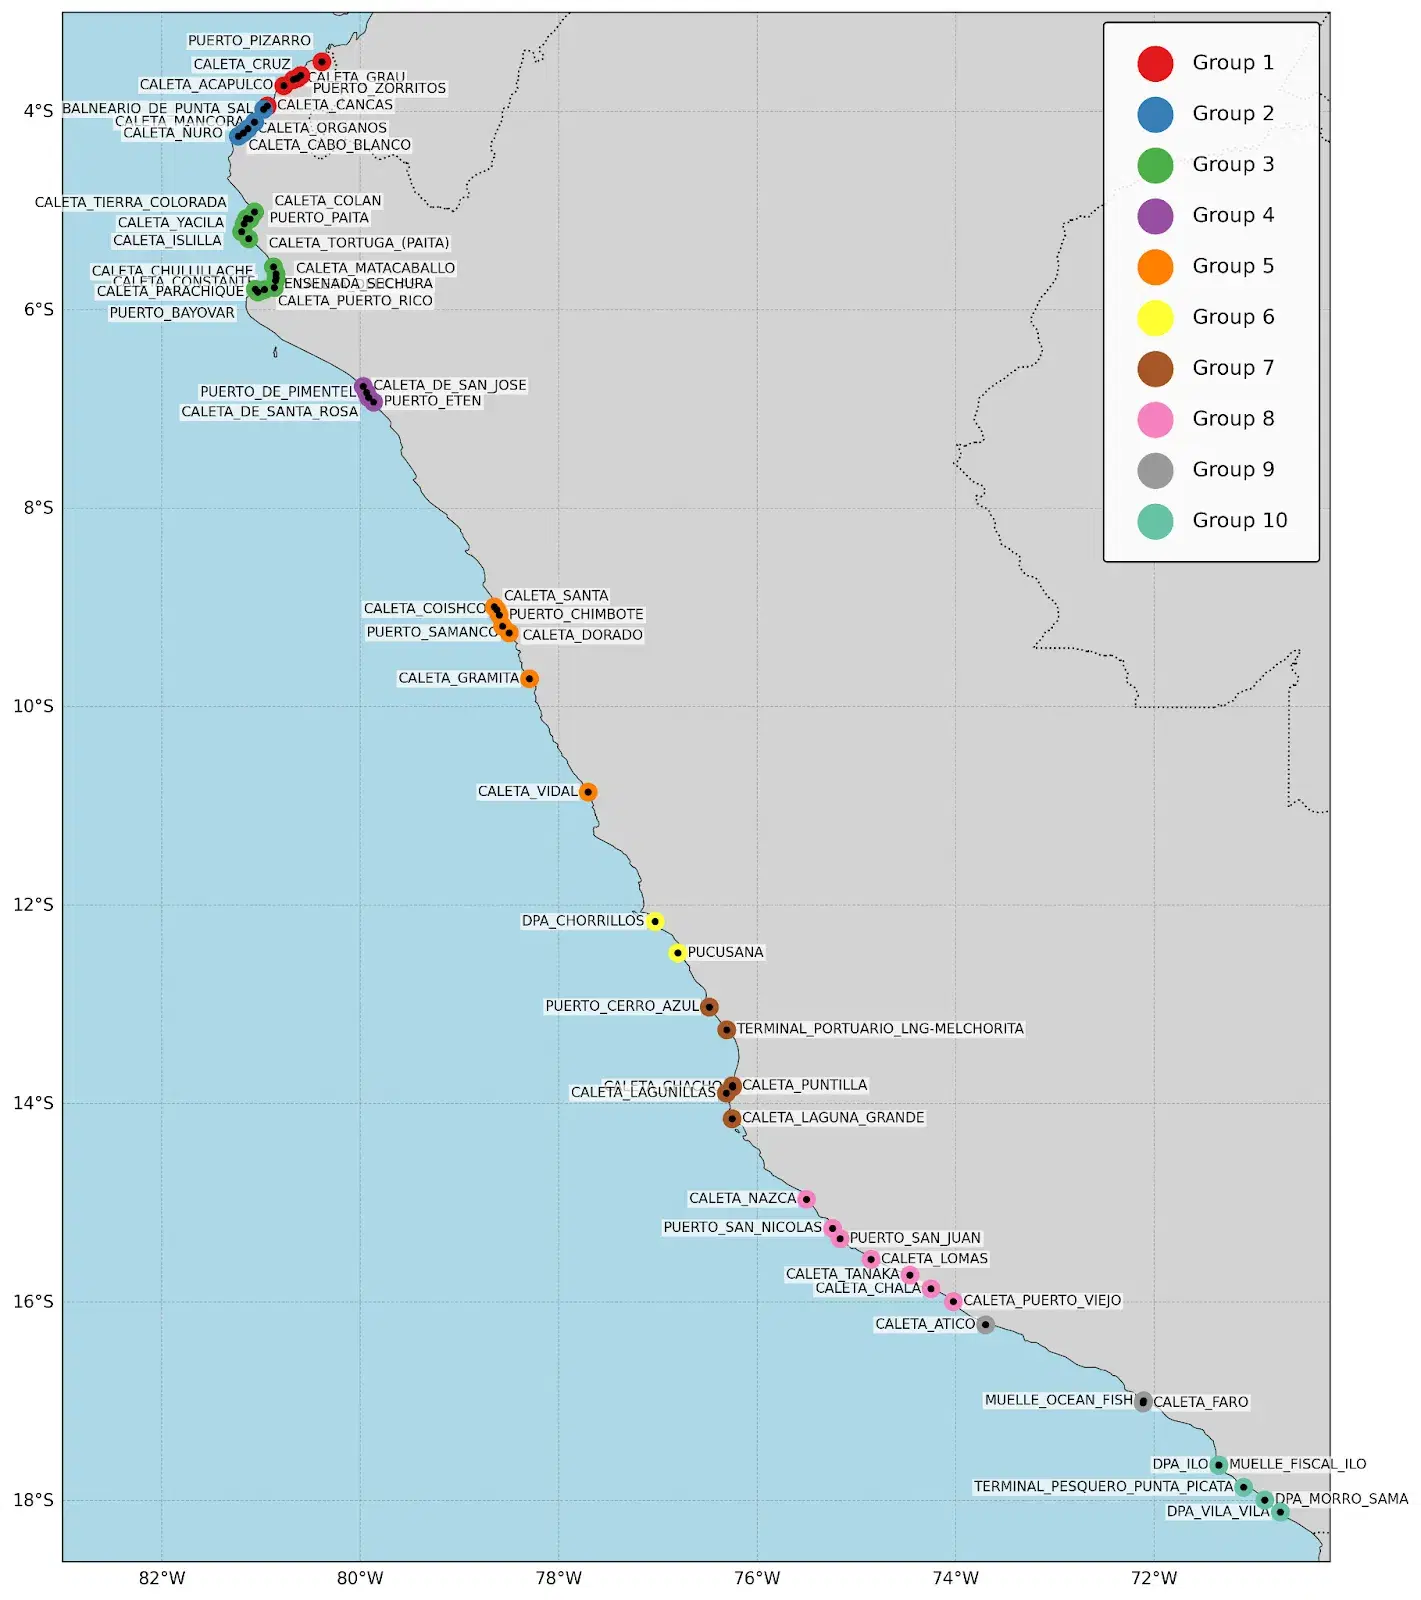
Major fishing caletas along Peru's northern coast affected by wave conditions
Testing prediction rules
Once the data foundation is established, Suyana's rule evaluation system tests hundreds of different prediction conditions to forecast dangerous events. The analysis evaluates rules like "when wave height exceeds 1.8 meters and anomaly conditions persist" or "when significant wave height combined with swell patterns indicates sustained rough seas." Each rule is tested using a rigorous cross-validation approach that prevents the model from simply memorizing historical patterns and ensures it can accurately predict future events. Alternative approaches were also tested, such as a suite of logistic regressions with different regularization parameters, and more complex machine learning algorithms specifically designed to address class imbalance. Alternative approaches were also tested, including complex machine learning algorithms specifically designed to address class imbalance. At the end, we selected the algorithms that offered the best accuracy while their interpretation remained transparent and allowed for a simpler product design.
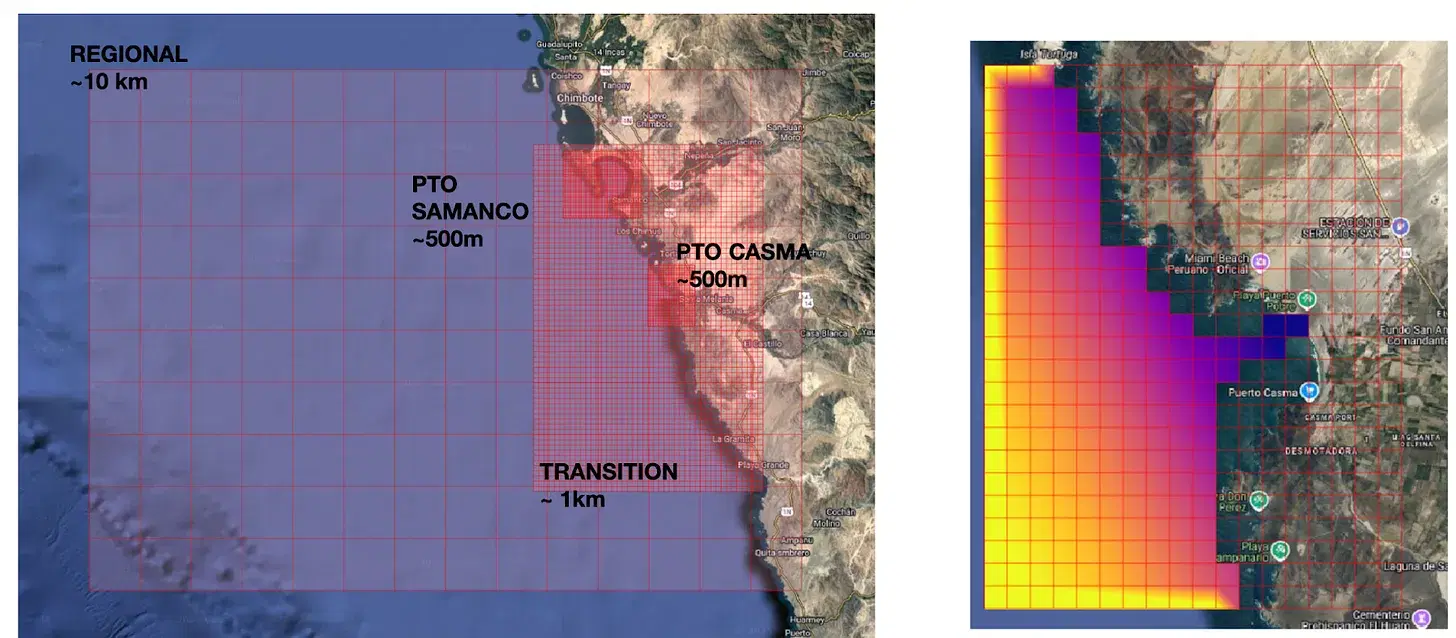
Grids are nested while becoming more granular, allowing us to accurately model complex coastline patterns.
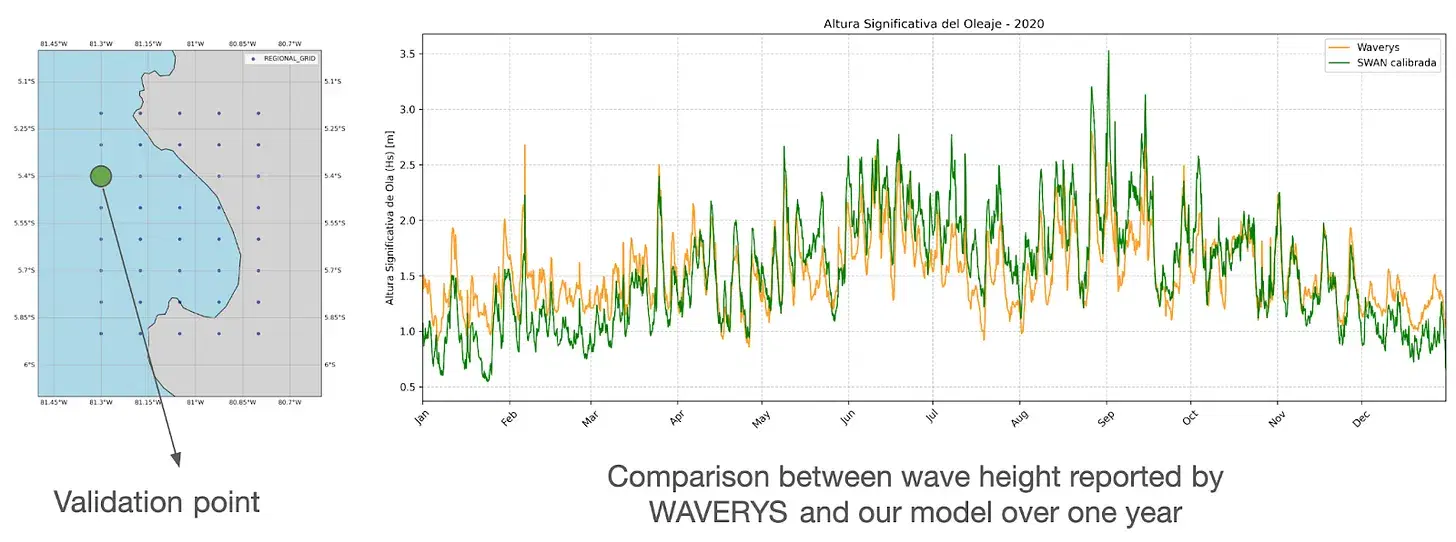
At specific points with satellite data, SWAN produces wave heights very similar to what we can actually observe.
The evaluation process employs a technique called time series cross-validation, which respects the temporal nature of oceanographic data. Unlike random sampling methods, this approach trains the model on historical data and tests its predictions on subsequent time periods, mimicking how the system would actually be used in practice. To effectively compute a loss distribution, we then perform thousands of simulations in a block-bootstrap setting, testing each rule across multiple time periods and parameter combinations to identify which conditions most reliably predict port-closing wave events.
2 / Understanding the economic impact
What emerges from this analysis is both scientifically and practically valuable. The most successful prediction rules focus on maximum wave height measurements from the SWAN model, particularly when these measurements deviate significantly from seasonal norms. A 2-meter wave in calm season might indicate trouble, while the same wave height during storm season could be relatively normal.
Perhaps most importantly, we were able to quantify the economic stakes involved. Using wage data from fishing communities across Peru's coast, we estimate that extreme wave events cost local economies millions of dollars annually. A typical 5-day port closure affects over 3,000 fishermen in a single region, with daily wages of approximately $12 per person adding up to nearly $200,000 in lost income for each extended event. When scaled across Peru's extensive coastline and multiple fishing seasons, these numbers represent substantial economic hardship for vulnerable communities. We were also able to capture interesting seasonal patterns in Peru's coastal wave climatology. Dangerous events cluster during the winter months, with the southern hemisphere winter bringing increased storm activity and higher baseline wave conditions. However, the most economically damaging events often occur during transition periods when fishing communities expect calmer conditions but encounter unexpected storms, such as some very rare storm events during December and January.
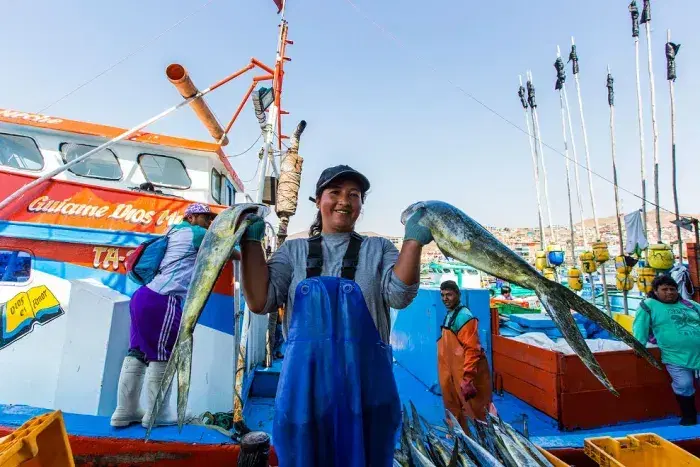
Artisanal fisherwoman in Peru with the day's catch (Source: PRODUCE)
3 / Looking ahead
Looking forward, this analytical framework represents more than just a specific solution for Peruvian fishing communities, it demonstrates how modern data science can address real-world problems affecting vulnerable populations. The combination of high-quality oceanographic modeling, machine learning, and careful economic analysis creates a template that could be adapted for coastal regions worldwide. As climate change continues to alter ocean patterns and extreme weather becomes more frequent, such predictive tools will become increasingly vital for protecting livelihoods and lives in coastal communities around the globe.